Moving Statistics – Industry Volume & Revenue as of 2019

The moving industry is considered to include “local and long-distance transportation of household and office goods as well as storage, warehousing, packing, packaging, processing, distribution, consulting, merchandise sales and other related services.”
The moving industry data on this page has been compiled mostly from the American Moving & Storage Association (AMSA) as well as the United States Census Bureau using the most recent reports available.



This information will be kept up to date with the most recent data as new trends emerge. Please check back for updated charts and statistics. Written and Created by Christopher Kemmett – Owner and Founder of Moving America.

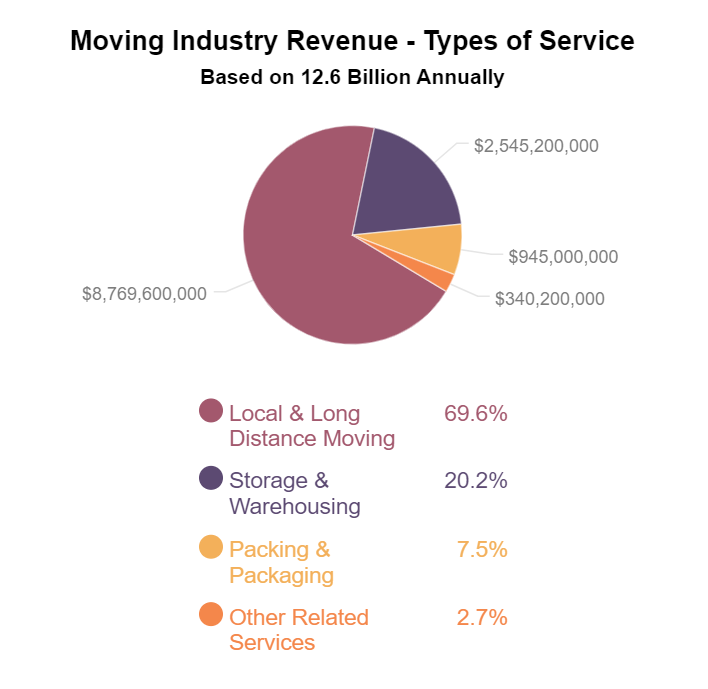
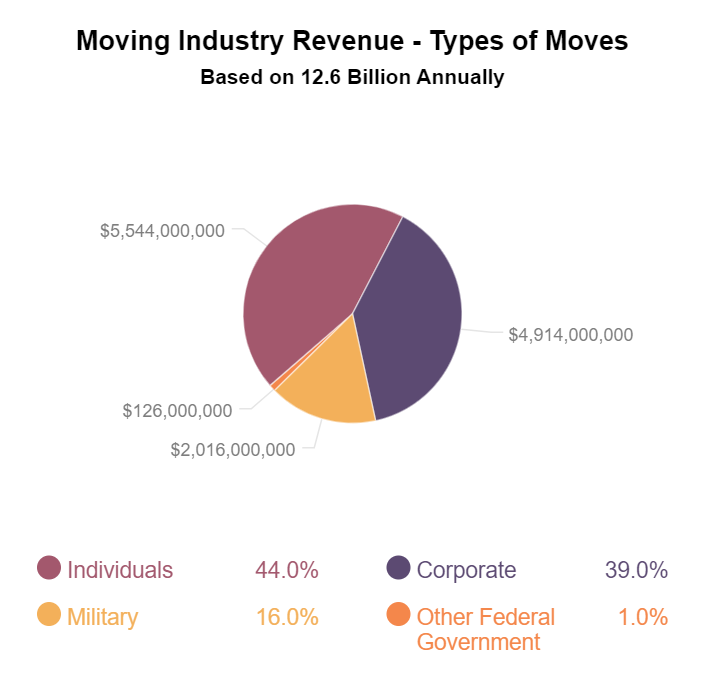
Moving Industry Vs. Revenue Statistics

This section is based on the most recent AMSA study. Other studies have found the moving industry to include 16-18 billion in revenue, but include different services in their studies.


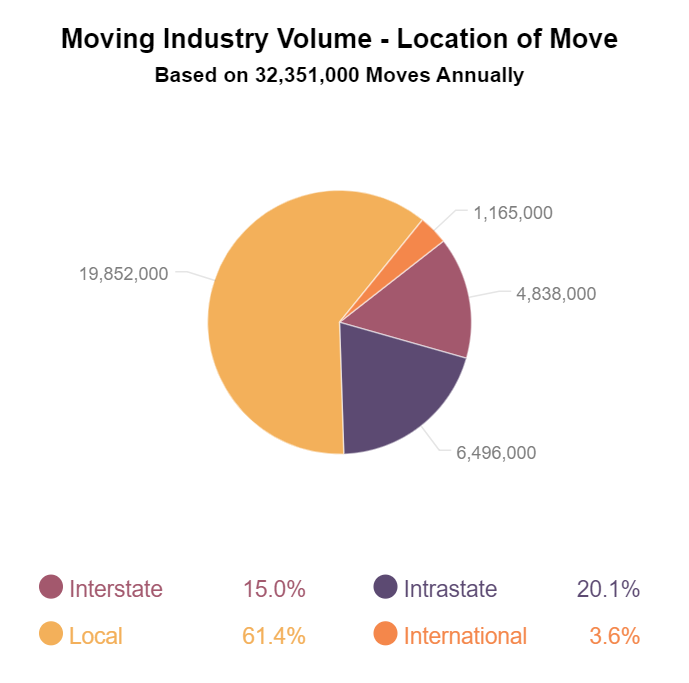
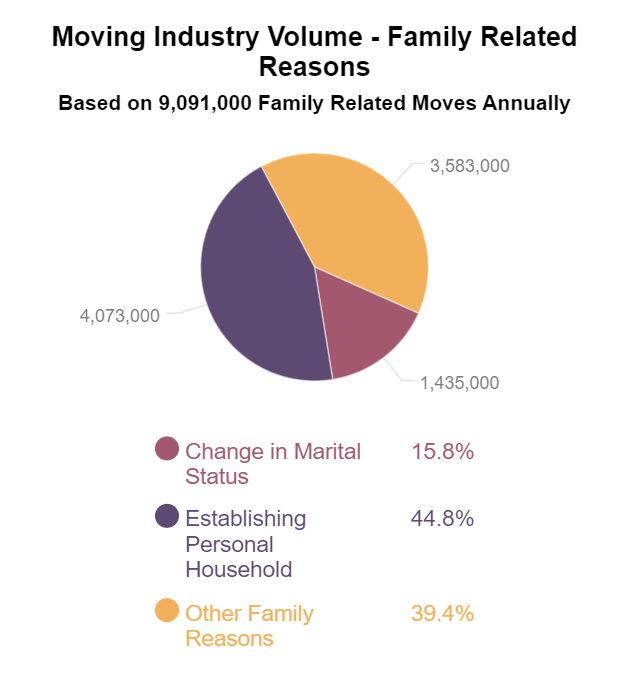
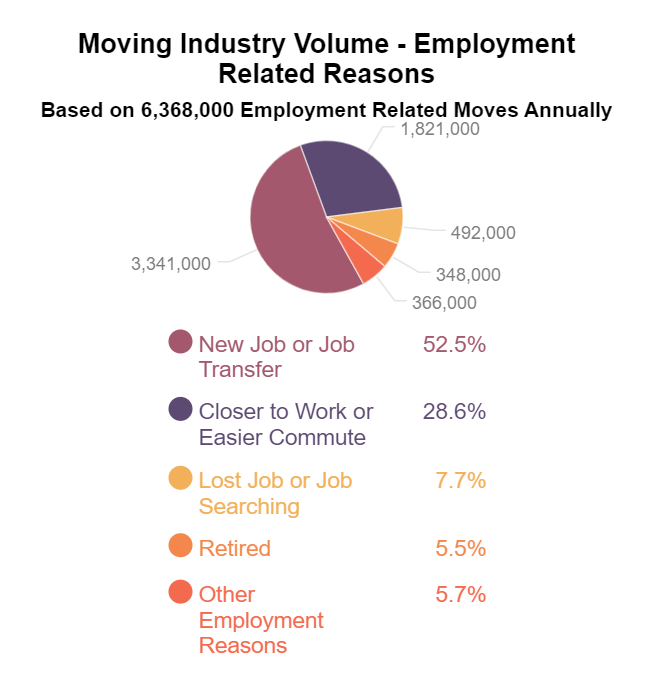
Moving Industry Vs. Volume Statistics
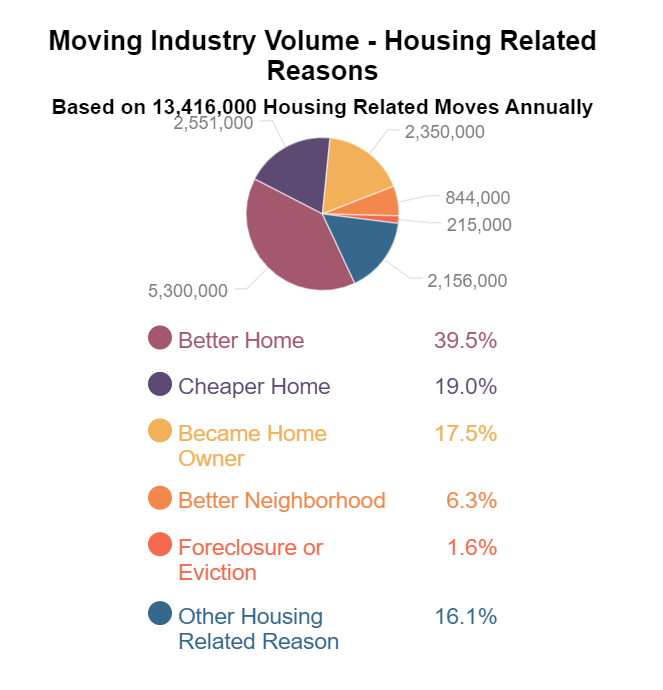
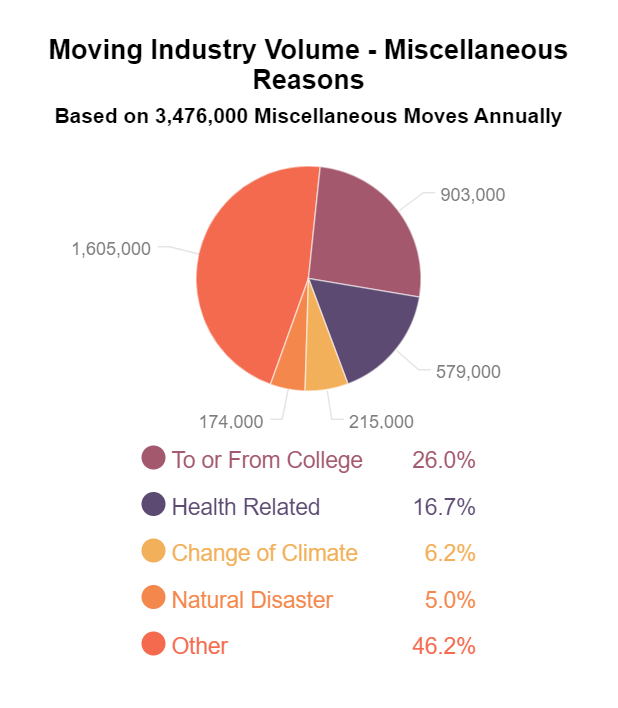

Moving Trends Compared
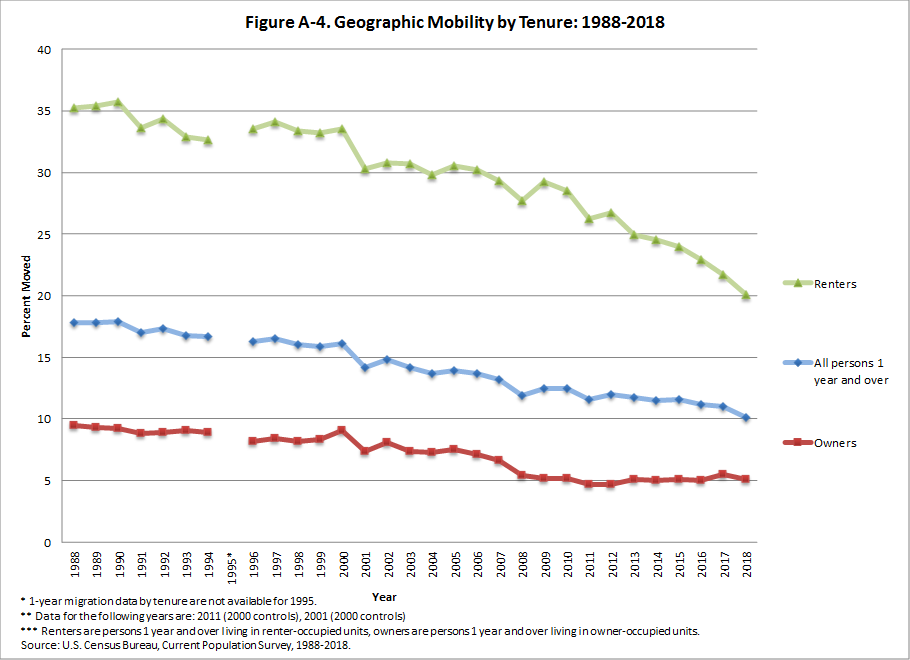
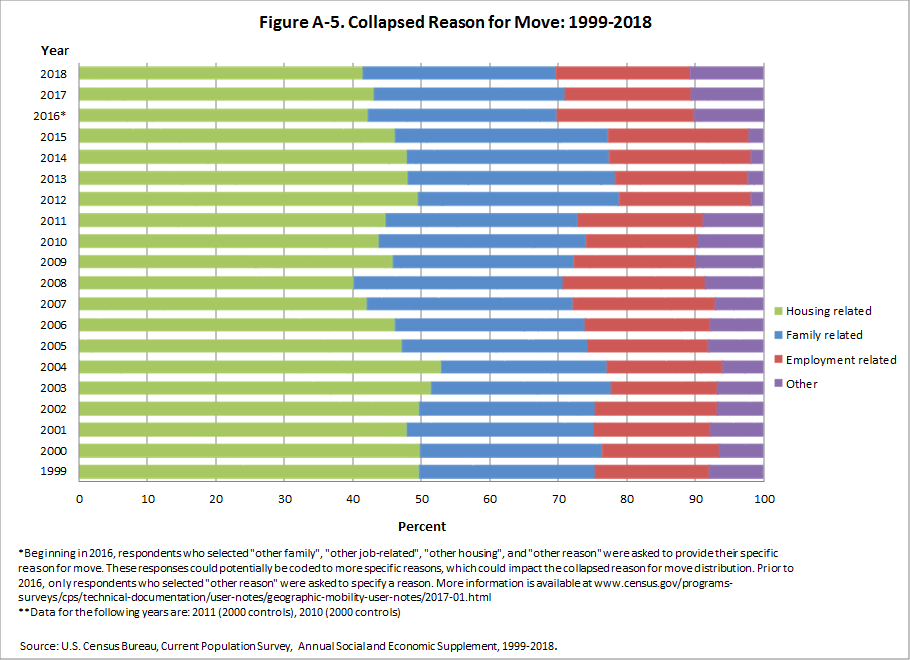
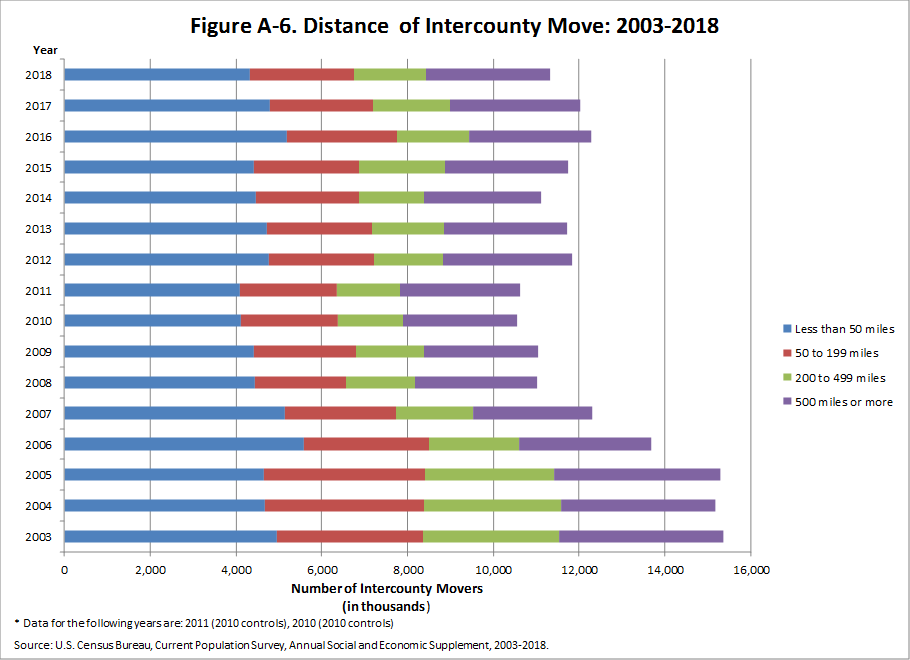
Additional Charts and Graphs Visualizing U.S. Moving Statistics Provided by the U.S. Census Bureau.
Home Owners vs. Renters Who Move
Reasons For Moving Over Time
Average Distances of a Non-Local Move
Hiring Professionals vs. Do-It-Yourself
According to AMSA’s study on interstate moves, approximately 21.7% of people moving will hire a mover for long hauls across the country. This is based on a study of 3 million interstate moves, where 650,000 people hired a mover, 1 million rented a truck and 1.35 million moved “un-assisted”.
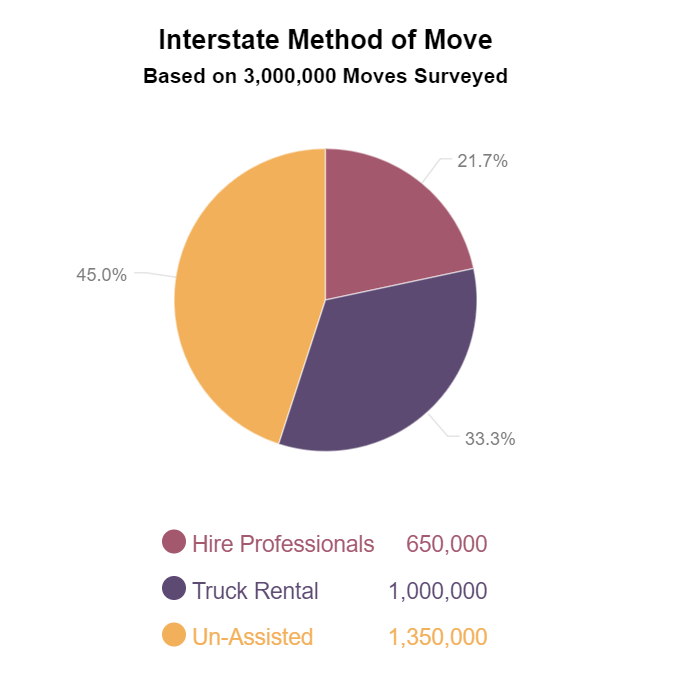
This means 78.3% of people are using moving trucks for their moves and are paying for that truck one way or the other.


Additional Studies Provided by America’s Largest Vanlines
- North American Vanlines (Interactive)
- Allied
- United Vanlines (Interactive)
- Sirva – Allied & North American (Global Studies)
- Mayflower
- Atlas

Happy Moving!


